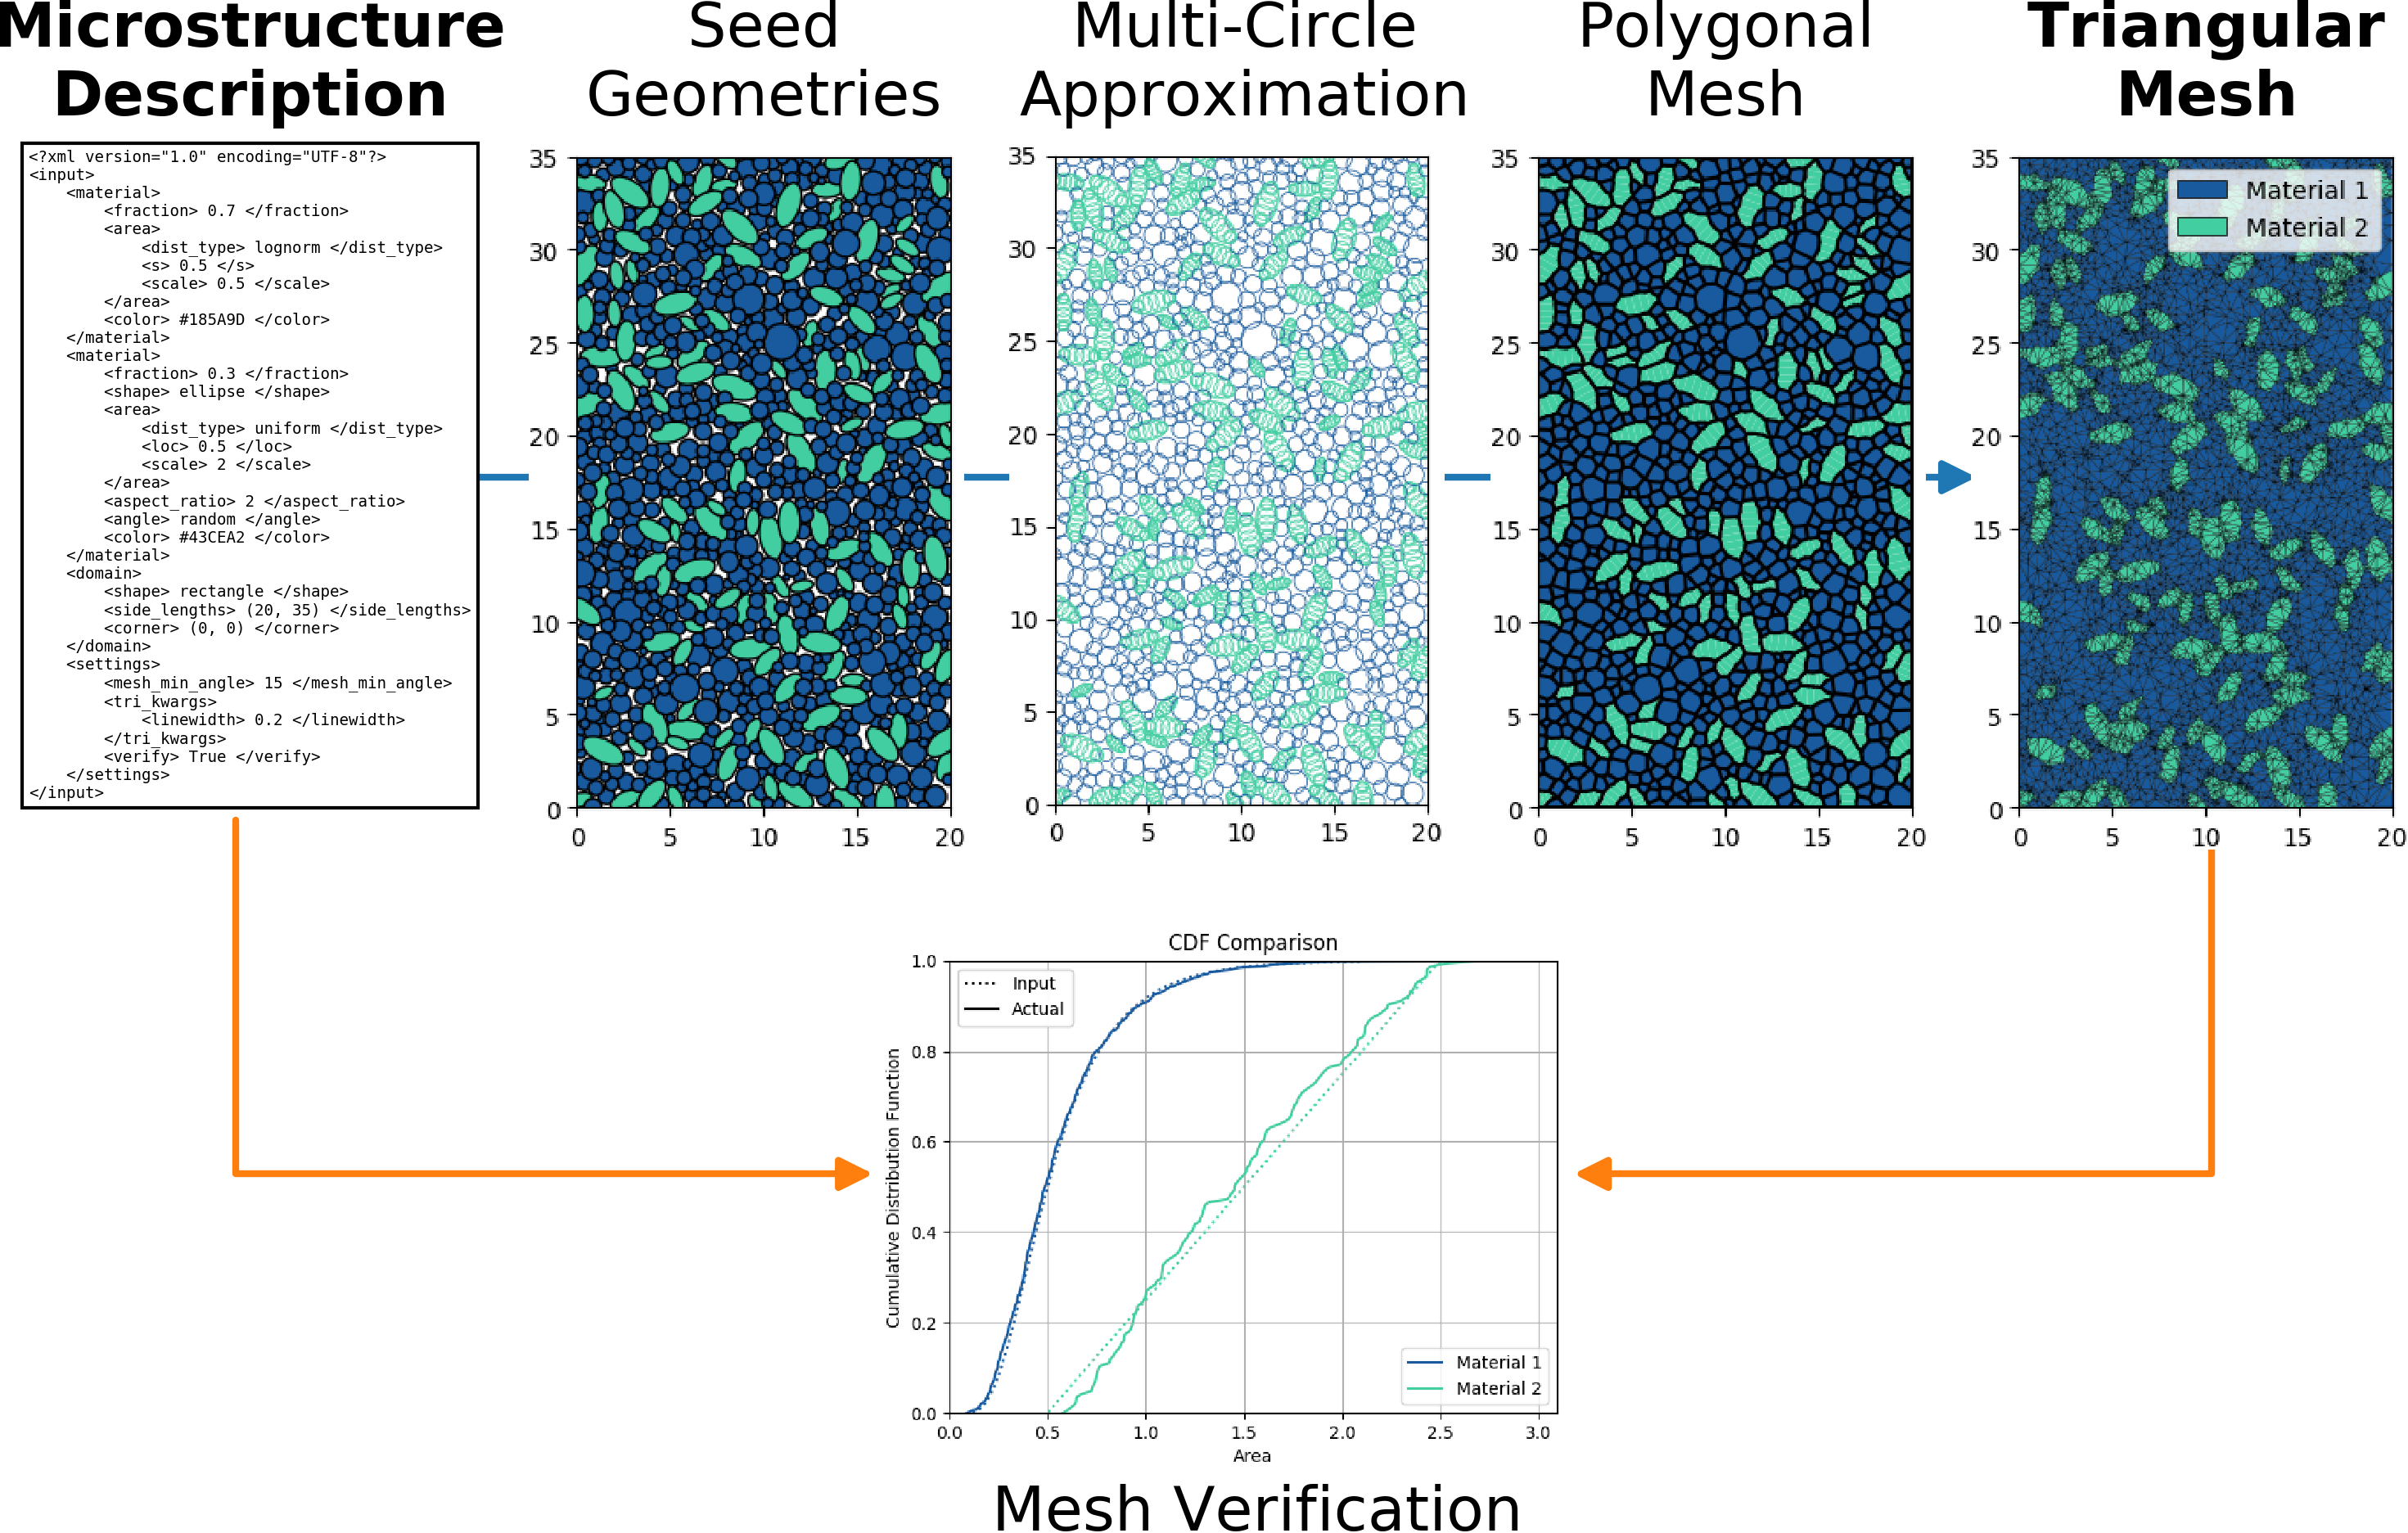
MicroStructPy Welcome Flowchart
Python Script
The basename for this file is msp_process.py.
The file can be run using this command:
microstructpy --demo=msp_process.py
The full text of the file is:
from __future__ import division

import os

import matplotlib.pyplot as plt
import microstructpy as msp
import numpy as np
from matplotlib.offsetbox import OffsetImage, TextArea, AnnotationBbox

inp_str = """
<?xml version="1.0" encoding="UTF-8"?>
<input>
    <material>
        <fraction> 0.7 </fraction>
        <area>
            <dist_type> lognorm </dist_type>
            <s> 0.5 </s>
            <scale> 0.5 </scale>
        </area>
        <color> #185A9D </color>
    </material>
    <material>
        <fraction> 0.3 </fraction>
        <shape> ellipse </shape>
        <area>
            <dist_type> uniform </dist_type>
            <loc> 0.5 </loc>
            <scale> 2 </scale>
        </area>
        <aspect_ratio> 2 </aspect_ratio>
        <angle> random </angle>
        <color> #43CEA2 </color>
    </material>
    <domain>
        <shape> rectangle </shape>
        <side_lengths> (20, 35) </side_lengths>
        <corner> (0, 0) </corner>
    </domain>
    <settings>
        <mesh_min_angle> 15 </mesh_min_angle>
        <tri_kwargs>
            <linewidth> 0.2 </linewidth>
        </tri_kwargs>
        <verify> True </verify>
    </settings>
</input>
""".lstrip()


def main():
    # Filenames
    file_dir = os.path.dirname(os.path.realpath(__file__))
    output_dir = os.path.join(file_dir, 'msp_process')

    xml_basename = 'process.xml'

    if not os.path.exists(output_dir):
        os.makedirs(output_dir)

    # Write XML File
    xml_filename = os.path.join(output_dir, xml_basename)
    with open(xml_filename, 'w') as file:
        file.write(inp_str)

    # Run XML File
    in_data = msp.cli.read_input(xml_filename)
    phases = in_data['material']
    domain = in_data['domain']
    kwargs = in_data['settings']
    msp.cli.run(phases, domain, **kwargs)

    # Plot Seed Breakdowns
    seedlist_filename = os.path.join(output_dir, 'seeds.txt')
    seeds = msp.seeding.SeedList.from_file(seedlist_filename)
    plot_breakdown(seeds, phases, domain, output_dir)

    # Combine Plots
    zoom_nom = 0.086
    px_nom = 742
    w = 0.78

    fig = plt.figure()
    ax = fig.add_axes([0, 0, w, w])

    ax.set_xlim(-11, 40)
    ax.set_ylim(0.5, 10)

    ax.set_axis_off()
    ax.get_xaxis().set_visible(False)
    ax.get_yaxis().set_visible(False)

    # Arrow
    y_xml_bot = 5.6
    y_top = 9
    y_mid = 0.5 * (y_xml_bot + y_top)
    x_min = -6.1
    x_side = 30.4
    x_max = 35
    x_mid = 0.5 * (x_min + x_max)

    x_verif_r = x_mid + 7
    y_verif_mid = 3.7
    x_verif_l = x_mid - 7

    cstyle = "angle,angleA=180,angleB=-90,rad=0"
    ax.annotate("",
                xy=(x_side, y_mid), xycoords='data',
                xytext=(x_min, y_mid), textcoords='data',
                arrowprops=dict(arrowstyle='-|>', color="C0",
                                patchA=None, patchB=None
                                ),
                )
    ax.annotate("",
                xy=(x_max, y_xml_bot), xycoords='data',
                xytext=(x_verif_r, y_verif_mid), textcoords='data',
                arrowprops=dict(arrowstyle='<|-', color="C1",
                                patchA=None, patchB=None,
                                connectionstyle=cstyle,
                                ),
                )
    ax.annotate("",
                xy=(x_min, y_xml_bot), xycoords='data',
                xytext=(x_verif_l, y_verif_mid), textcoords='data',
                arrowprops=dict(arrowstyle='<|-', color="C1",
                                patchA=None, patchB=None,
                                connectionstyle=cstyle,
                                ),
                )

    # - Text of XML file
    ob_xml = TextArea(inp_str.rstrip(),
                      textprops={'fontsize': 2.3, 'family': 'monospace'})
    ab_xml = AnnotationBbox(ob_xml, (-10.4, 9 - 0.01), pad=0.1,
                            box_alignment=(0, 1),
                            bboxprops={'linewidth': 0.5})
    ax.add_artist(ab_xml)

    # - Seeds Plot
    arr_seeds = plt.imread(os.path.join(output_dir, 'seeds.png'))
    zoom = zoom_nom * px_nom / arr_seeds.shape[1]
    ob_seeds = OffsetImage(arr_seeds, zoom=zoom)
    ab_seeds = AnnotationBbox(ob_seeds, (0, 9),
                              pad=0, box_alignment=(0, 1),
                              bboxprops={'edgecolor': 'none'})
    ax.add_artist(ab_seeds)

    # - Breakdown Plot
    bkdwn_filename = os.path.join(output_dir, 'breakdown.png')
    remove_whitespace(bkdwn_filename)
    arr_bkdwn = plt.imread(bkdwn_filename)
    zoom = zoom_nom * px_nom / arr_bkdwn.shape[1]
    ob_bkdwn = OffsetImage(arr_bkdwn, zoom=zoom)
    ab_bkdwn = AnnotationBbox(ob_bkdwn, (10, 9),
                              pad=0, box_alignment=(0, 1),
                              bboxprops={'edgecolor': 'none'})
    ax.add_artist(ab_bkdwn)

    # - Polymesh Plot
    arr_poly = plt.imread(os.path.join(output_dir, 'polymesh.png'))
    zoom = zoom_nom * px_nom / arr_poly.shape[1]
    ob_poly = OffsetImage(arr_poly, zoom=zoom)
    ab_poly = AnnotationBbox(ob_poly, (20, 9),
                             pad=0, box_alignment=(0, 1),
                             bboxprops={'edgecolor': 'none'})
    ax.add_artist(ab_poly)

    # - Trimesh Plot
    arr_tri = plt.imread(os.path.join(output_dir, 'trimesh.png'))
    zoom = zoom_nom * px_nom / arr_tri.shape[1]
    ob_tri = OffsetImage(arr_tri, zoom=zoom)
    ab_tri = AnnotationBbox(ob_tri, (30, 9),
                            pad=0, box_alignment=(0, 1),
                            bboxprops={'edgecolor': 'none'})
    ax.add_artist(ab_tri)

    # - Verification Plot
    verif_x = x_mid
    verif_filename = os.path.join(output_dir, 'verification', 'area_cdf.png')
    remove_whitespace(verif_filename)
    arr_verif = plt.imread(verif_filename)
    zoom = zoom_nom * 0.7 * 1645 / arr_verif.shape[1]
    ob_verif = OffsetImage(arr_verif, zoom=zoom)
    ab_verif = AnnotationBbox(ob_verif, (verif_x, 2.2),
                              pad=0, box_alignment=(0.5, 0),
                              bboxprops={'edgecolor': 'none'})
    ax.add_artist(ab_verif)

    # Add Titles
    y_txt = 9.1
    off = -0.1
    fs = 9
    plt.text(x_min + 0.3, y_txt, 'Microstructure\nDescription',
             fontsize=fs, weight='bold', va='bottom', ha='center')
    plt.text(5 + off, y_txt, 'Seed\nGeometries', fontsize=fs,
             va='bottom', ha='center')
    plt.text(15 + off, y_txt, 'Multi-Circle\nApproximation', fontsize=fs,
             va='bottom', ha='center')
    plt.text(25 + off, y_txt, 'Polygonal\nMesh', fontsize=fs,
             va='bottom', ha='center')
    plt.text(35 + off, y_txt, 'Triangular\nMesh', fontsize=fs,
             weight='bold', va='bottom', ha='center')
    plt.text(verif_x + 0.7, 2.1, 'Mesh Verification', fontsize=fs,
             va='top', ha='center')

    # Save Figure
    out_filename = os.path.join(output_dir, 'process.png')
    plt.savefig(out_filename, dpi=600)
    plt.clf()

    # Remove Whitespace
    remove_whitespace(out_filename)


def plot_breakdown(seeds, phases, domain, output_dir):
    plt.clf()
    seed_colors = [phases[s.phase]['color'] for s in seeds]
    seeds.plot_breakdown(edgecolors=seed_colors, facecolor='none',
                         linewidth=0.5)

    lims = domain.limits
    plt.axis('square')
    plt.xlim(lims[0])
    plt.ylim(lims[1])
    plt.savefig(os.path.join(output_dir, 'breakdown.png'))


def remove_whitespace(filename):
    im = plt.imread(filename)
    rgb = im[:, :, :-1]
    mask = rgb.min(axis=-1) < 1
    col_mask = np.any(mask, axis=0)
    row_mask = np.any(mask, axis=1)
    row_i = np.argmax(row_mask)
    row_j = len(row_mask) - np.argmax(np.flip(row_mask)) + 2

    col_i = np.argmax(col_mask)
    col_j = len(col_mask) - np.argmax(np.flip(col_mask)) + 2

    new_im = im[row_i:row_j, col_i:col_j]
    plt.imsave(filename, new_im)


if __name__ == '__main__':
    main()
XML File
This example first writes an XML file and calls the CLI to produce
the output plots.
This file is saved to msp_process/process.xml.
Breakdown Plot
MicroStructPy does no produce plots of seed breakdowns by default.
To include this plot in the flow chart, the SeedList.plot_breakdown()
method is called, then the plot is formatted and saved.