Getting Started
This page covers topics for new users to get started using MicroStructPy.
Download & Installation
To install MicroStructPy, download it from PyPI using:
pip install microstructpy
If there is an error with the install, try to install pybind11 first.
You may need to add the --user flag, depending on your permissions.
This installs both the microstructpy Python package and the
microstructpy command line interface (CLI).
To verify installation of the package, run python and enter the command:
>>> import microstructpy
If the import succeeds without an error message, then MicroStructPy installed successfully.
To verify that the command line interface has been installed,
run microstructpy --help to see if the man page is printed.
If it is not, then the install location may not be in your PATH variable.
The most likely install location is ~/.local/bin for Mac or Linux machines.
For Windows, it may be in a path similar to
~\AppData\Roaming\Python\Python36\Scripts\.
From Source
To install from source, navigate to the GitHub repository to clone or download the latest release. Unzip the source if necessary and change directories to the top-level folder. From this folder, run the command:
pip install -e .
Note
If the install fails and the last several error messages reference
pybind11, run pip install pybind11 first then install MicroStructPy.
Running Demonstrations
MicroStructPy comes with several demonstrations to familiarize users with its capabilities and options. A demonstration can be run from the command line by:
microstructpy --demo=docs_banner.xml
When a demo is run, the XML input file is copied to the current working directory. To see a full list of available demos, visit the Examples page.
Using the Python Package
The MicrostructPy package contains several classes and users can customize their workflows depending on their needs. For example:
import os

import matplotlib.pyplot as plt
import microstructpy as msp


# Create domain
domain = msp.geometry.Square()

# Create list of seed points
factory = msp.seeding.Seed.factory
n = 50
seeds = msp.seeding.SeedList([factory('circle', r=0.01) for i in range(n)])
seeds.position(domain)

# Create Voronoi diagram
pmesh = msp.meshing.PolyMesh.from_seeds(seeds, domain)

# Plot Voronoi diagram and seed points
pmesh.plot(edgecolors='k', facecolors='gray')
seeds.plot(edgecolors='k', facecolors='none')

plt.axis('square')
plt.xlim(domain.limits[0])
plt.ylim(domain.limits[1])

file_dir = os.path.dirname(os.path.realpath(__file__))
filename = os.path.join(file_dir, 'standard_voronoi/voronoi_diagram.png')
dirs = os.path.dirname(filename)
if not os.path.exists(dirs):
    os.makedirs(dirs)
plt.savefig(filename)
The commands above create a Voronoi diagram with 50 random seed points:
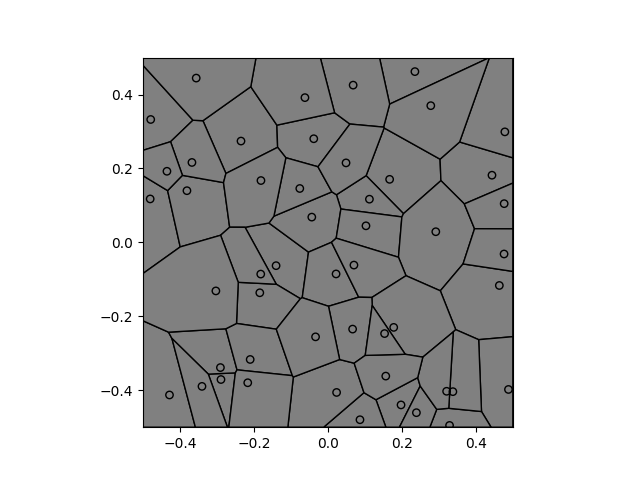
Plot resulting from the Python script above.
More information about this example is available on the Standard Voronoi Diagram page. The Python Package Guide page has more details on writing scripts with the package and the standard data flow.