Microstructure Mesh Process
Python Script
The basename for this file is docs_banner.py.
The file can be run using this command:
microstructpy --demo=docs_banner.py
The full text of the file is:
from __future__ import division

import os

import numpy as np
import scipy.stats
from matplotlib import pyplot as plt

import microstructpy as msp


def main():
    # Colors
    c1 = '#12C2E9'
    c2 = '#C471ED'
    c3 = '#F64F59'

    # Offset
    off = 1

    # Create Directory
    dirname = os.path.join(os.path.dirname(__file__), 'docs_banner')
    if not os.path.exists(dirname):
        os.makedirs(dirname)

    # Create Domain
    domain = msp.geometry.Rectangle(width=10, length=20)

    # Create Unpositioned Seeds
    phase2 = {'color': c1}
    ell_geom = msp.geometry.Ellipse(a=8, b=3)
    ell_seed = msp.seeding.Seed(ell_geom, phase=2)

    mu = 1
    bnd = 0.5
    d_dist = scipy.stats.uniform(loc=mu-bnd, scale=2*bnd)
    phase0 = {'color': c2, 'shape': 'circle', 'd': d_dist}
    phase1 = {'color': c3, 'shape': 'circle', 'd': d_dist}
    circle_area = domain.area - ell_geom.area
    seeds = msp.seeding.SeedList.from_info([phase0, phase1], circle_area)

    seeds.append(ell_seed)
    hold = [False for seed in seeds]
    hold[-1] = True
    phases = [phase0, phase1, phase2]

    # Create Positioned Seeds
    seeds.position(domain, hold=hold, verbose=True)

    # Create Polygonal Mesh
    pmesh = msp.meshing.PolyMesh.from_seeds(seeds, domain)

    # Create Triangular Mesh
    tmesh = msp.meshing.TriMesh.from_polymesh(pmesh,
                                              min_angle=12,
                                              max_edge_length=0.2,
                                              max_volume=0.4)

    # Create Figure
    k = 0.12
    len_x = 3 * domain.length + 4 * off
    len_y = domain.width + 2 * off
    fig = plt.figure(figsize=(k * len_x, k * len_y))

    # Plot Seeds
    seed_colors = [phases[s.phase]['color'] for s in seeds]
    seeds.plot(color=seed_colors, alpha=0.8, edgecolor='k', linewidth=0.3)
    domain.plot(facecolor='none', edgecolor='k', linewidth=0.3)

    # Plot Polygonal Mesh
    pmesh.points = np.array(pmesh.points)
    pmesh.points[:, 0] += domain.length + off
    for region, phase_num in zip(pmesh.regions, pmesh.phase_numbers):
        if phase_num == 2:
            continue
        color = phases[phase_num]['color']

        facets = [pmesh.facets[f] for f in region]
        kps = ordered_kps(facets)
        x, y = zip(*[pmesh.points[kp] for kp in kps])
        plt.fill(x, y, color=color, alpha=0.8, edgecolor='none')

    ellipse_regions = set()
    for region_num, phase_num in enumerate(pmesh.phase_numbers):
        if phase_num == 2:
            ellipse_regions.add(region_num)

    ellipse_facets = []
    for facet, neighbors in zip(pmesh.facets, pmesh.facet_neighbors):
        common_regions = ellipse_regions & set(neighbors)
        if len(common_regions) == 1:
            ellipse_facets.append(facet)
    ellipse_kps = ordered_kps(ellipse_facets)
    x, y = zip(*[pmesh.points[kp] for kp in ellipse_kps])
    plt.fill(x, y, color=phases[-1]['color'], alpha=0.8, edgecolor='none')

    for facet, neighbors in zip(pmesh.facets, pmesh.facet_neighbors):
        common_regions = ellipse_regions & set(neighbors)
        if len(common_regions) < 2:
            x, y = zip(*[pmesh.points[kp] for kp in facet])
            plt.plot(x, y, color='k', linewidth=0.3)

    # Plot Triangular Mesh
    tmesh.points = np.array(tmesh.points)
    tmesh.points[:, 0] += 2 * off + 2 * domain.length
    tri_colors = [seed_colors[n] for n in tmesh.element_attributes]
    tmesh.plot(color=tri_colors, alpha=0.8, edgecolor='k', linewidth=0.2)

    # Set Up Axes
    plt.gca().set_position([0, 0, 1, 1])
    plt.axis('image')
    plt.gca().set_axis_off()
    plt.gca().get_xaxis().set_visible(False)
    plt.gca().get_yaxis().set_visible(False)

    xlim, ylim = domain.limits
    xlim[0] -= off
    xlim[1] += 3 * off + 2 * domain.length

    ylim[0] -= off
    ylim[1] += off

    plt.axis(list(xlim) + list(ylim))

    fname = os.path.join(dirname, 'banner.png')
    plt.savefig(fname, bbox_inches='tight', pad_inches=0)
    plt.savefig(fname.replace('.png', '.pdf'), bbox_inches='tight', pad_inches=0)


def ordered_kps(pairs):
    t_pairs = [tuple(p) for p in pairs]
    kps = list(t_pairs.pop())
    while t_pairs:
        for i, pair in enumerate(t_pairs):
            if kps[-1] in pair:
                break
        assert kps[-1] in pair, pairs
        kps += [kp for kp in t_pairs.pop(i) if kp != kps[-1]]
    return kps[:-1]


if __name__ == '__main__':
    main()
Domain Geometry
The materials fill a rectangular domain with side lengths 20 and 10. The center of the rectangle defaults to the origin.
Seeds
The first material is phase 2, which contains a single elliptical seed with semi-axes 8 and 3. Next, phases 0 and 1 are created with identical size distributions and different colors. The size distributions are uniform random from 0.5 to 1.5. Seeds of phase 0 and phase 1 are generated to fill the area between the rectangular domain and the elliptical seed from phase 2.
Next, the phase 2 seed is appended to the list of phase 0 and 1 seeds.
A hold list is then created to indicate to
position()
which seeds should have their positions (centers) held.
The default position of a seed is the origin, so by setting the hold flag to
True for the elliptical seed, it will be fixed to the center of the domain
while the remaining seeds will be randomly positioned around it.
Polygonal and Triangular Meshing
Once the seeds are positioned in the domain, a polygonal mesh is created using
from_seeds().
The triangular mesh is created using
from_polymesh(),
with the quality control settings min_angle, max_edge_length, and
max_volume.
Plot Figure
The figure contains three plots: the seeds, the polygonal mesh, and the
triangular/unstructured mesh.
First, the seeds plot is generated using SeedList
plot()
and Rectangle
plot()
to show the boundary of the domain.
The seeds are plotted with some transparency to show overlap.
Next, the polygonal mesh is translated to the right and plotted in such a way that avoids the internal geometry of the elliptical seed. This internal geometry is created by the multi-circle approximation used in polygonal meshing, then removed during the triangular meshing process. In the interest of clarity, these two steps are combined and the elliptical grain is plotted without internal geomtry.
Finally, the triangular mesh is translated to the right of the polygonal mesh
and plotted using TriMesh
plot().
Once all three plots have been added to the figure, the axes and
aspect ratio are adjusted.
This figure is shown in Fig. 27.
The PNG and PDF versions of this plot are saved in a folder named
docs_banner, in the current directory (i.e ./docs_banner).
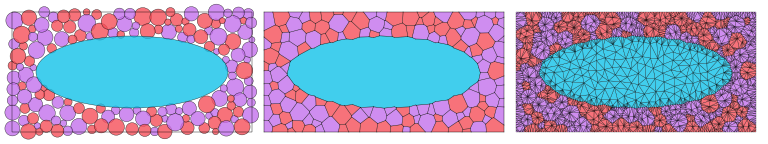
Fig. 27 Microstructure meshing process.
The three major steps are: 1) seed the domain with particles, 2) create a Voronoi power diagram, and 3) convert the diagram into an unstructured mesh.